
Media centre
- 2016-01-08 Lietuvio vadovaujamos komandos inovacija padės kovoti su vėžiu (www.delfi.lt)
- 2015-12-22 Vėžio žymenų tyrimams - inovacija. įkvėpta gamtos (www.ifpa.lt)
- 2015-12-22 Vėžio žymenų tyrimams - inovacija, įkvėpta gamtos (www.laisvaslaikrastis.lt)
- 2015-12-22 Vėžio žymenų tyrimams - inovacija, įkvėpta gamtos (sc.bns.lt)
- 2015-12-22 Vėžio žymenų tyrimams - inovacija, įkvėpta gamtos (www.regionunaujienos.lt)
- 2015-12-22 Vėžio žymenų tyrimams - inovacija, įkvėpta gamtos (www.manosveikata.lt)
- 2015-12-21 Vėžio žymenų tyrimams pasitelktas "medaus korio" metodas (www.naujienos.vu.lt)
- 2015-12-21 Vėžio žymenų tyrimams - inovacija, įkvėpta gamtos (www.vpc.lt)
- 2015-12-17 Vėžio žymenų tyrimams - inovacija, įkvėpta gamtos (www.mf.vu.lt)
- 2015-12-17 Vėžio žymenų tyrimams - inovacija, įkvėpta gamtos (www.santaroszinios.lt)
- 2015-06-02 Kanų ir Vilniaus universitetai pasirašė bendradarbiavimo sutartį skaitmeninės patologijos srityje, Prof. Arvydas Laurinavičius ir Benoit Plancoulaine
- 2015-06 Unicaen & l’Universitete de Vilnius ont signe un accord de collaboration en pathologie numerique (2015-06 Kanų universiteto naujienaiškis Phenix)
- 2015-06-01 Kanų ir Vilniaus universitetai pasirašė bendradarbiavimo sutartį skaitmeninės patologijos srityje
- 2015-05-14 Krūties vėžys “kompiuterinės bites akimis” (Lietuvos sveikata, Nr. 20(116), 2015-05-14)
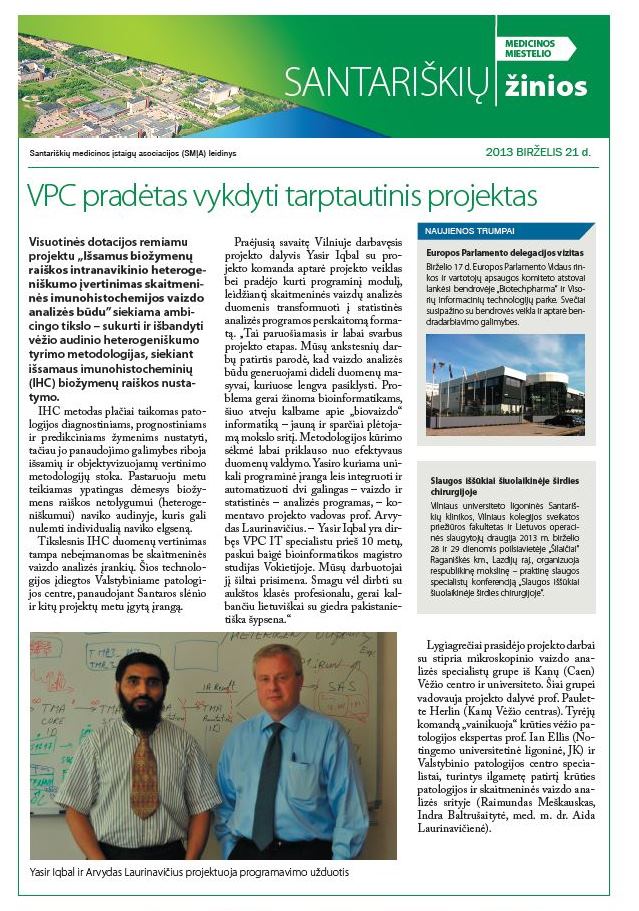
- 2013-06-21 Pradėtas vykdyti tarptautinis projektas
- 2013-06-21 Pradėtas vykdyti tarptautinis projektas (SMĮA naujienlaiškis)
- 2013-04-16 Gauta parama projektui "Išsamus biožymenų raiškos intranavikinio heterogeniškumo įvertinimas skaitmeninės imunohistochemijos vaizdo analizės būdu"
 Prof. Arvydas Laurinavičius with a team of researchers
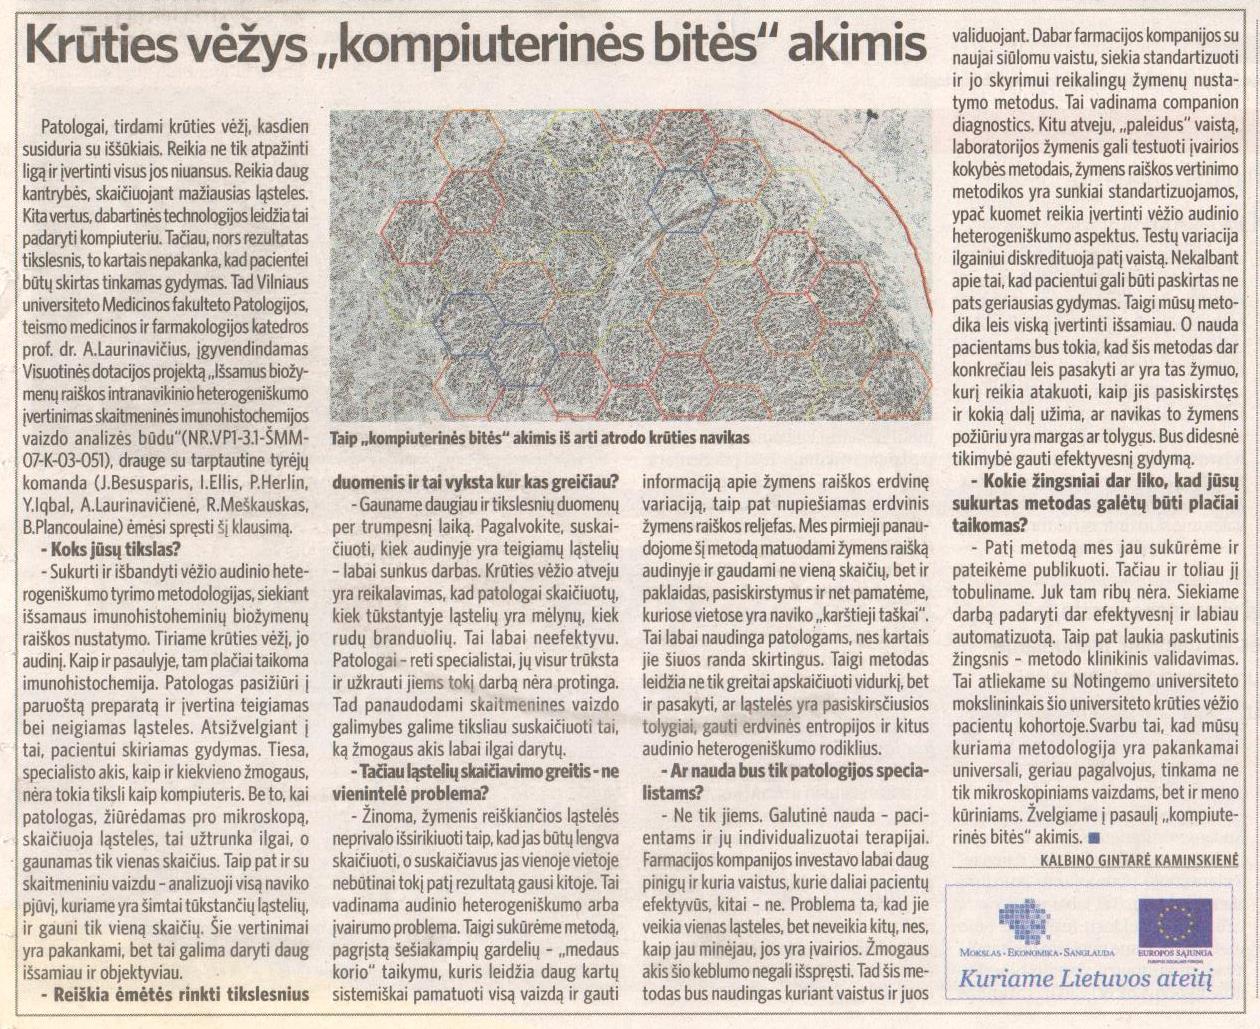